


You click "Buy" on a new crypto project. The price isn't set by a human trader or a complex order book of bids and asks. Instead, a line of code calculates the exact cost based on how many tokens already exist. This is the power of bonding curves. They are the invisible engine behind some of the most innovative token launches and decentralized exchanges today.
If you've ever wondered why the price of a token changes instantly with every single transaction, or how a project can launch without a centralized exchange listing, bonding curves are the answer. They solve the biggest problem in early-stage markets: liquidity. Without them, new tokens often sit worthless because no one is willing to buy first. With them, there is always a buyer or seller-the protocol itself.
What Is a Bonding Curve?
In simple terms, a bonding curve is a formula. It says: "If Supply is X, then Price is Y." As more people buy tokens, the supply goes up, and the curve dictates that the price must go up too. When people sell, the supply drops, and the price falls. There is no middleman. There is no inventory risk for an individual trader. The smart contract holds the reserve assets (like ETH or USDC) and mints or burns tokens on demand.
This mechanism eliminates the "double coincidence of wants" problem found in traditional exchanges. You don't need to find another person who wants your specific token at this exact second. You just interact with the curve. If you want to buy, you pay the curve. If you want to sell, the curve pays you. This guarantees liquidity 24/7, which is revolutionary for new projects trying to find their footing.
How Bonding Curves Work in Practice
The magic happens in the math. Most bonding curves use one of three shapes, each serving a different purpose in tokenomics.
- Linear Curves: The price increases at a steady rate. For example, if the base price is $1 and the slope is $0.10, the first token costs $1.00, the second $1.10, and the third $1.20. This is predictable but doesn't create strong scarcity incentives.
- Exponential Curves: The price accelerates as supply grows. This is common in early token launches. It rewards early adopters heavily but punishes latecomers with steep prices. It creates a sense of urgency and scarcity.
- Logarithmic Curves: The price growth slows down as supply increases. These are often used for stablecoins or assets where you want to prevent wild volatility. The price stabilizes over time rather than skyrocketing.
When you execute a trade, you aren't just paying the current price. You are moving along the curve. If you buy 100 tokens, you pay the integral sum of the prices from token #1 to token #100. This means large orders cause significant slippage-the average price you pay is higher than the starting price. This is a feature, not a bug; it prevents whales from dumping all the supply at once and crashing the market artificially.
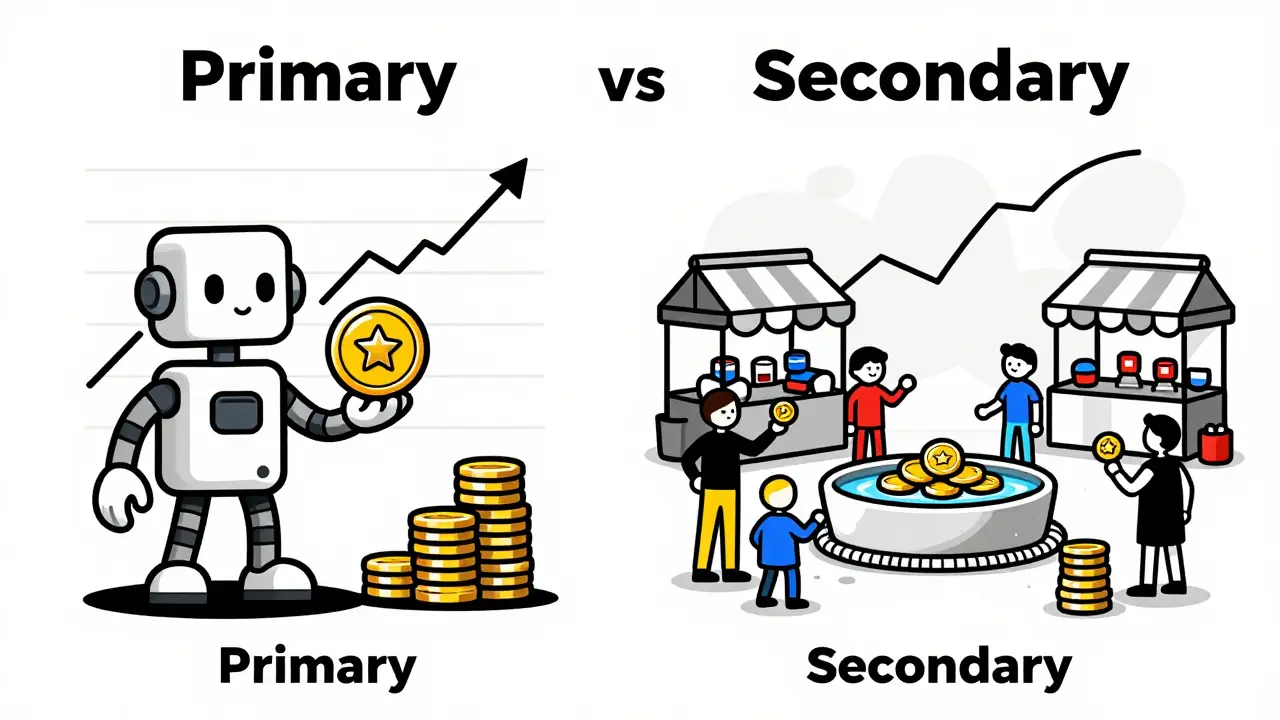
Primary vs. Secondary Automated Market Makers
Bonding curves operate in two distinct environments, and understanding the difference is crucial for investors and developers alike.
| Feature | Primary AMM (PAM) | Secondary AMM (SAM) |
|---|---|---|
| Purpose | Initial token distribution & launch | Ongoing trading of established tokens |
| Price Discovery | Algorithmic, starting from zero or low base | Market-driven, reflecting broader sentiment |
| Liquidity Source | Protocol reserves (minted/burned) | User-provided liquidity pools |
| Example Protocol | Aavegotchi (GHST launch) | Uniswap v2/v3 (Constant Product) |
| Risk Profile | High volatility, speculative | Moderate, dependent on pool depth |
Primary Automated Market Makers (PAMs) are used during the launch phase. Projects like Aavegotchi used a bonding curve to distribute their GHST token. Users bought GHST with DAI, and the price rose automatically as the supply increased. This allowed fair distribution to thousands of users without needing a centralized exchange listing. It solved the "chicken-and-egg" problem: how do you get liquidity before anyone owns the token? The curve provided immediate depth.
Secondary Automated Market Makers (SAMs) handle trading after the launch. Uniswap is the giant here. Its famous constant product formula ($x \times y = k$) is a type of bonding curve. It ensures that the product of the two token reserves remains constant. If someone buys ETH from the pool, the ETH reserve goes down, so the price of ETH in terms of the other token goes up. This maintains balance and provides continuous liquidity for existing assets.
Pros and Cons for Investors and Developers
Bonding curves are powerful tools, but they aren't perfect. Knowing the trade-offs helps you decide whether to build with them or invest in projects using them.
The Advantages
- Guaranteed Liquidity: Unlike order books that can go dry, a bonding curve always has a counterparty (the contract). You can always buy or sell, even if the volume is low.
- Fair Access: In PAM launches, everyone sees the same price curve. No insiders can front-run the market because the pricing is transparent and algorithmic.
- Low Barrier to Entry: Retail investors can participate in early stages without KYC hurdles or waiting for CEX listings. This democratizes access to new projects.
- Automated Price Discovery: The market finds the price through actual trades, not speculation or fixed IPO-style valuations.
The Disadvantages
- Slippage on Large Orders: Because the price moves with every unit traded, buying a large amount pushes the price up significantly. You might pay much more than the initial quote. This makes bonding curves less efficient for high-volume institutional trading.
- Price Distortion: Critics, including Ethereum core developers, note that bonding curves can disconnect from broader market sentiment. If the wider crypto market crashes, a bonding curve might not reflect that drop immediately unless users actively sell. This can lead to artificial inflation or deflation relative to external benchmarks.
- Manipulation Risks: In low-liquidity scenarios, sophisticated actors can manipulate the curve by executing wash trades or strategic sells to trigger price movements, though this is harder than manipulating thin order books.
- Complexity for Users: Understanding integrals and curve slopes is hard. Many users lose money simply because they didn't calculate the true cost of a bulk purchase.
Real-World Examples and Lessons Learned
Looking at real deployments gives us concrete insights into what works and what doesn't.
Aavegotchi (2021): Their GHST token launch is a textbook case of a successful PAM. The bonding curve allowed the community to fund the project while gradually increasing the token price. It created a loyal holder base because early participants saw value appreciation. However, users complained about brutal slippage when trying to buy large amounts during peak hype periods.
Uniswap (Ongoing): As the dominant SAM, Uniswap proves that bonding curves can scale to billions in daily volume. But it also highlights the limits of pure bonding curves. That's why Uniswap v3 introduced "concentrated liquidity," allowing providers to narrow their price ranges. This is a hybrid approach that tries to reduce impermanent loss and improve capital efficiency, acknowledging that a static curve isn't enough for mature markets.
Nirvana Capital (2024): This serves as a cautionary tale. The SEC took action against Nirvana Capital's bonding curve implementation, arguing that the predictable price appreciation mechanics constituted an unregistered security offering. This reminds developers that regulatory scrutiny is increasing. If your curve guarantees profit through design, regulators may view it as an investment contract.
The Future: Hybrids and Optimizations
The technology isn't standing still. By 2026, we're seeing a shift toward smarter, more responsive curves.
- Hybrid Models: Protocols are combining bonding curves with limit orders. Uniswap v4 hooks allow developers to add custom logic, such as responding to external oracle data. This means a curve could adjust its slope based on real-world events or broader market trends, reducing distortion.
- Dynamic Adjustment: Bancor v3 pioneered curves that change shape automatically. If volatility spikes, the curve flattens to provide deeper liquidity. If the market is calm, it steepens to reward holders. This adaptability addresses the rigidity of older models.
- L2 Scaling: Gas costs were a major barrier to minting/burning on mainnet Ethereum. With Layer 2 solutions becoming standard, bonding curves are now cheaper to interact with, making micro-transactions viable. This opens the door for finer-grained economic experiments.
Experts remain divided on long-term viability. Messari warns that pure bonding curves have fundamental flaws for long-term valuation, suggesting they will be displaced by concentrated liquidity models in secondary markets. Conversely, Electric Capital reports that 78% of protocol builders plan to integrate bonding curves in their roadmaps, believing they will become the standard for on-chain asset pricing.
For now, bonding curves remain essential for token launches. They offer a unique blend of fairness, automation, and accessibility that traditional methods can't match. Whether they evolve to dominate secondary trading depends on how well they can integrate with external data and user preferences. One thing is certain: they have permanently changed how we think about digital scarcity and market creation.
What is the main advantage of using a bonding curve for a token launch?
The primary advantage is guaranteed liquidity. Unlike traditional launches that require finding buyers and sellers simultaneously, a bonding curve allows anyone to buy or sell at any time. The smart contract acts as the counterparty, minting new tokens for buyers and burning sold tokens, ensuring the market never runs dry.
How does slippage work on a bonding curve?
Slippage occurs because the price changes with every token traded. If you buy a large quantity, you are pushing the price up along the curve. You pay the average price of all those incremental steps, which is higher than the initial price. This protects small holders from being dumped on by whales but means large buyers should expect to pay more per token.
Are bonding curves safe from manipulation?
They are more resistant to front-running than order books because the pricing is algorithmic and transparent. However, they are not immune. In low-liquidity scenarios, actors can manipulate prices by executing large trades to spike or crash the curve. Additionally, if the curve is disconnected from external market data, it can create artificial valuations that don't reflect reality.
What is the difference between PAM and SAM?
PAM stands for Primary Automated Market Maker, used for launching new tokens and distributing them fairly (e.g., Aavegotchi). SAM stands for Secondary Automated Market Maker, used for trading existing tokens with established value (e.g., Uniswap). PAMs focus on discovery and initial liquidity, while SAMs focus on efficient ongoing trading.
Can I build my own bonding curve?
Yes, but it requires solid smart contract development skills. You need to implement the mathematical function correctly in Solidity, ensuring accurate integral calculations for pricing. Mistakes in these calculations can lead to significant financial losses. It is recommended to use audited libraries or frameworks like Speedrun Ethereum's guides to avoid common pitfalls.


Stephanie Frank
4 Jun 2026 at 17:56you really think this math magic fixes the fact that most of these tokens are just rug pulls waiting to happen? its cute how you try to explain away slippage as a feature when it's just a way for devs to bleed retail dry. i've seen enough bonding curve launches fail because the 'liquidity' was an illusion created by code that couldn't handle actual market sentiment. stop pretending this is innovation and call it what it is: a sophisticated scam mechanism designed to trick people who don't understand calculus into buying worthless air. the nirvana capital lawsuit proves regulators see through your 'fair access' bullshit too.