


Have you ever been on a critical client call only to have your voice turn into robotic gibberish or freeze completely? It’s frustrating, unprofessional, and usually impossible to fix in the moment. The real work happens after the call drops. You need to know exactly why it happened so it doesn’t happen again. That process is called root cause analysis (RCA) for Voice over IP (VoIP). But here’s the catch: looking at one metric alone rarely tells the whole story. To truly find the culprit, you have to correlate user-experienced quality metrics with deep network data.
Key Takeaways
- MOS scores provide a high-level view of quality but must be broken down into latency, jitter, and packet loss to diagnose issues.
- Network telemetry like interface errors and QoS queue drops often reveals hardware or configuration problems that MOS scores hide.
- Specific patterns, such as high jitter with low latency, point directly to microbursts or Wi-Fi contention rather than general congestion.
- Signal-based models like ViSQOL offer deeper insight when standard RTP statistics don't match user complaints.
- Continuous monitoring and automated correlation are essential because most VoIP degradation is intermittent and time-sensitive.
Understanding the Core Metrics: Beyond the MOS Score
When a user complains about bad call quality, the first thing many IT teams check is the Mean Opinion Score (MOS). Defined by the ITU-T, MOS is a scale from 1 to 5, where 5 is excellent and 1 is bad. In modern VoIP systems, this score isn’t calculated by having humans listen to every call. Instead, it’s algorithmically derived from Real-Time Transport Protocol (RTP) statistics. A score between 4.3 and 4.5 is generally considered good, while anything below 3.6 signals significant user dissatisfaction.
However, relying solely on MOS is like looking at a car’s dashboard warning light without knowing which engine part failed. The MOS score is an aggregate result. To perform effective RCA, you need to dissect the three primary drivers behind that number: latency, jitter, and packet loss. Each of these metrics interacts differently with the network infrastructure, and each points to a distinct set of potential root causes.
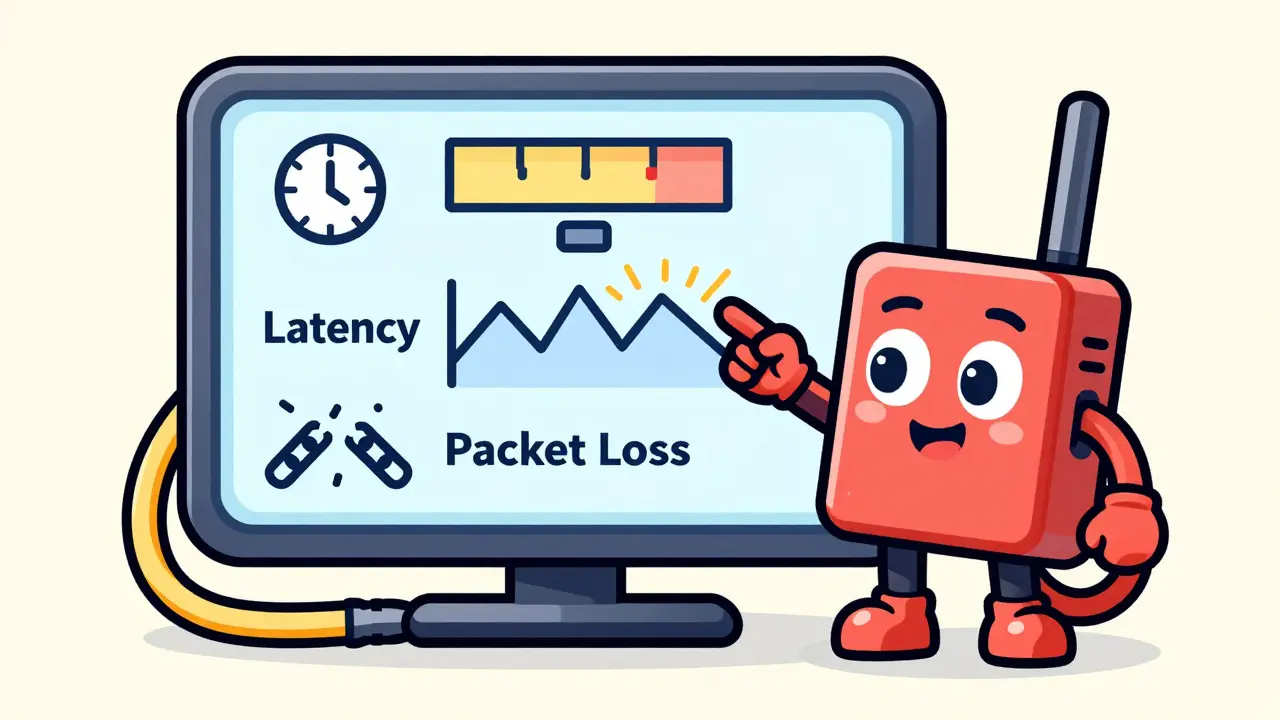
Latency is the one-way delay between when sound is made and when it is heard. Jitter is the variation in that delay between consecutive packets. Packet loss is the percentage of RTP packets that never reach their destination. While MOS gives you the "what" (the call was bad), these three metrics give you the "why." Understanding how they degrade the user experience is the foundation of any successful troubleshooting strategy.
Decoding Latency: When Silence Speaks Volumes
Latency is often the least noticeable impairment until it becomes severe. For transparent conversations, industry standards suggest keeping one-way latency under 150 milliseconds. Round-trip delays above 300 ms start to cause talk-over issues, where people interrupt each other because they can’t hear the immediate response. Echoes also become more prominent as latency increases.
If your RCA shows consistently high latency across multiple calls, the problem is usually structural. Long WAN paths, complex routing tables, or heavy encryption overheads at VPN gateways can add tens of milliseconds per hop. PathSolutions notes that elevated latency often points to bandwidth congestion or suboptimal routing. If you see high latency but low jitter and low packet loss, look at your physical topology. Are your voice packets taking a scenic route through multiple firewalls? Are you traversing a congested MPLS link during peak hours?
To pinpoint the source, you need to track per-hop delay. Tools that visualize the end-to-end path allow you to see exactly where the delay spikes occur. Is it at the edge router? The core switch? Or somewhere in the service provider’s cloud? Without this granular visibility, you’re just guessing which segment of the network is slowing things down.
Taming Jitter: The Enemy of Smooth Audio
Jitter is arguably the most disruptive factor for real-time voice. Unlike latency, which is a steady delay, jitter is unpredictable variation. When packets arrive at irregular intervals, the receiving device must buffer them to smooth out the audio. This creates a trade-off: if the jitter buffer grows too large, latency increases; if it stays small, late packets are dropped, leading to packet loss.
In RCA scenarios, high jitter is frequently caused by bursting traffic and queue contention on shared network links. Imagine a busy highway where cars (data packets) are trying to merge onto a narrow exit ramp (your VoIP link). Some cars get through quickly, others wait in line. This variability is jitter. AIS highlights that even short-term congestion or microbursts at specific interfaces can cause significant jitter spikes.
A common pattern to look for is high jitter combined with relatively low average latency. This often implicates local network issues, such as Wi-Fi interference or a misconfigured Quality of Service (QoS) policy. If VoIP packets aren’t prioritized in the network queues, they compete with bulk data transfers like file backups or video streaming. By correlating jitter spikes with interface utilization graphs and QoS queue statistics, you can confirm whether lack of priority is the root cause.
Packet Loss: The Silent Killer of Clarity
Packet loss has a disproportionate impact on perceived voice quality compared to similar variations in latency or jitter. Even single-digit percentages of loss can lead to audible gaps, clipping, or robotic voices. Since VoIP typically uses UDP for transport, there are no retransmissions. If a packet is lost, it’s gone forever.
When investigating packet loss, you must distinguish between congestion-related drops and hardware-related errors. Congestion occurs when a link is oversubscribed, and the router simply discards excess packets. This is often visible as simultaneous spikes in interface utilization and discard counters. On the other hand, if you see high packet loss with normal utilization but increasing interface errors (like CRC errors), the issue is likely physical. Faulty cabling, bad transceivers, or duplex mismatches on switch ports can corrupt packets before they even enter the queue.
PathSolutions emphasizes that interface error counters are crucial for this distinction. If your MOS drops and you see packet loss, check the SNMP polling data for your switches and routers. Are there collisions? Are there input/output errors? These counters tell you if the problem is logical (congestion/QoS) or physical (hardware/cabling).

The Hybrid Approach: Combining Network Telemetry with Signal-Based Models
Traditional RCA relies heavily on RTP statistics (latency, jitter, loss) to calculate MOS. However, sometimes the network looks fine, but users still complain. This is where signal-based models come into play. Algorithms like PESQ (Perceptual Evaluation of Speech Quality) and ViSQOL (Virtual Speech Quality Objective Listener) analyze the actual audio stream rather than just the network headers.
ViSQOL, for instance, works by injecting a known audio tone at one end of the call and recording the output at the other. It then computes an audio MOS that closely models human perception. This method can detect impairments caused by codec artifacts, echo cancellation failures, or background noise suppression algorithms that standard network metrics miss. Sipfront argues that these sophisticated audio quality metrics are essential for RCA scenarios where network data appears inconsistent with user feedback.
For comprehensive coverage, adopt a hybrid approach. Use continuous network monitoring for early detection of latency, jitter, and loss. Then, deploy targeted signal-based testing when you encounter intermittent issues or when MOS scores don’t align with complaint volumes. This dual-layer strategy ensures you catch both network-induced degradations and application-level audio processing errors.
| Symptom Pattern | Primary Metric Impact | Likely Root Cause | Actionable Fix |
|---|---|---|---|
| Robotic voice, choppy audio | High Jitter | Queue contention, Wi-Fi interference, microbursts | Implement strict QoS, upgrade Wi-Fi APs, isolate voice VLANs |
| Talk-over, echo, delayed response | High Latency | Long WAN paths, overloaded routers, suboptimal routing | Optimize routing tables, increase bandwidth, reduce hops |
| Gaps in speech, missing words | High Packet Loss | Congested links, faulty cabling, duplex mismatch | Check interface errors, replace cables, enable Forward Error Correction (FEC) |
| Low MOS despite good network stats | Audio Artifacts | Codec incompatibility, poor echo cancellation | Use ViSQOL/PESQ testing, adjust endpoint settings, change codecs |
Building a Proactive RCA Workflow
Effective root cause analysis shouldn’t be reactive. Waiting for users to complain means the damage is already done. Modern VoIP analytics platforms emphasize continuous monitoring and automated alerting. Tools like SolarWinds, Paessler PRTG, and NetBeez generate synthetic test calls and monitor live traffic to establish baselines.
Your workflow should start with detection. Set proactive alerts for deviations in latency, jitter, and packet loss thresholds. When an alert triggers, drill into the Call Detail Records (CDRs) and RTP statistics to identify the dominant impairment. Once you know the symptom (e.g., loss vs. delay), correlate the timestamp and path of affected calls with infrastructure-level data. Look at CPU utilization on routers, memory usage on switches, and bandwidth consumption on WAN circuits.
Automated analysis can highlight recurring patterns. For example, if MOS drops every day at 2 PM, check if a large backup job starts at that time. If specific branches always report jitter, inspect the local internet connection or Wi-Fi density. By mapping each call’s end-to-end path, you can associate impairments with specific segments or devices, turning vague complaints into precise engineering tickets.
Implementation Strategies for Lasting Improvement
Finding the root cause is only half the battle. You need actionable strategies to prevent recurrence. Balto recommends ensuring about 100 kbps of bandwidth per concurrent G.711 call. If bandwidth is constrained, consider switching to more efficient codecs like G.729 or Opus. However, remember that compression can introduce its own artifacts, so test thoroughly.
Quality of Service (QoS) remains the most critical configuration tool. Ensure that voice traffic is marked with appropriate Differentiated Services Code Point (DSCP) values and prioritized at every hop, from the endpoint to the core router. Misconfigured QoS policies are a frequent culprit in VoIP degradation, often placing voice packets in low-priority queues alongside bulk data.
Finally, foster cross-team collaboration. VoIP spans network engineering, unified communications (UC), and security teams. Network engineers manage the pipes, UC engineers manage the endpoints and servers, and security teams manage the firewalls. Siloed troubleshooting leads to finger-pointing. Shared dashboards and integrated monitoring tools help break down these silos, allowing all teams to see the same correlated data and resolve issues faster.
What is the ideal MOS score for VoIP calls?
A MOS score between 4.3 and 4.5 is considered excellent. Scores above 4.0 are generally acceptable for business use. Anything below 3.6 indicates significant quality issues that will likely frustrate users and require immediate investigation.
How do I distinguish between jitter and latency issues?
Latency manifests as a consistent delay, causing talk-over and echo. Jitter manifests as variation in delay, causing choppy or robotic audio. If your network shows high average delay but stable packet arrival times, it’s a latency issue. If delays fluctuate wildly, it’s jitter.
Why does my MOS score drop even when network bandwidth seems available?
Bandwidth availability doesn’t guarantee quality. Issues like Wi-Fi interference, misconfigured QoS, or hardware errors (CRC errors) can degrade quality without saturating the link. Additionally, codec artifacts or echo cancellation failures can lower MOS scores independent of network conditions.
What is the role of QoS in VoIP root cause analysis?
QoS ensures voice packets are prioritized over other data. In RCA, checking QoS queue statistics helps determine if voice traffic was dropped due to contention. If voice packets are in a best-effort queue during peak traffic, jitter and packet loss will increase significantly.
Should I use ViSQOL instead of standard MOS calculations?
ViSQOL provides a more accurate representation of human-perceived audio quality by analyzing the actual audio stream. It’s best used as a supplement to standard RTP-based MOS when network metrics appear normal but users still report poor quality, helping to identify codec or endpoint processing issues.


om gman
19 Jun 2026 at 21:38oh look another article telling us to check our cables because apparently we are all idiots who cant configure qos properly
i mean sure if your network is held together by duct tape and prayers then maybe packet loss is the issue but for the rest of us who actually understand tcp/ip this is like explaining how to tie shoes to a toddler
also why do people still use g711 in 2024 its so last century