

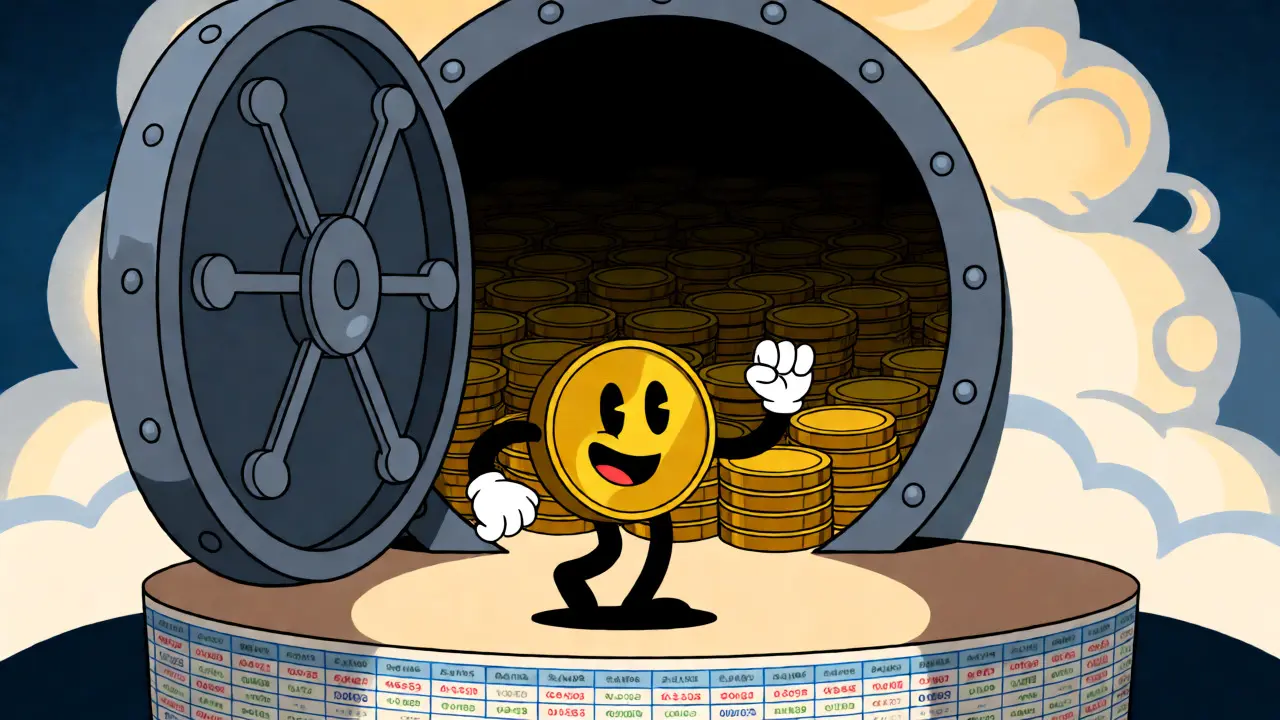

You see a coin trading at $1.00 with a market cap of $1 billion. It looks cheap, right? Maybe you think it has room to grow. But if that project only has 5% of its tokens actually out in the wild, you are looking at a ticking time bomb. The other 95% is waiting to hit the market, ready to dilute your investment.
Understanding token supply is not just about counting coins. It is about understanding scarcity, inflation, and risk. Most beginners mix up the three main metrics-Maximum Supply, Circulating Supply, and Total Supply. Mixing them up leads to bad trades and lost money. Let’s clear this up so you can spot the difference between a real opportunity and a liquidity trap.
The Three Pillars of Token Metrics
To value any cryptocurrency, you need to know exactly how many units exist and where they are. These numbers aren't static; they change based on protocol rules, burns, and unlocks. Here is what each term actually means for your wallet.
| Metric | Definition | Why It Matters |
|---|---|---|
| Circulating Supply | Tokens currently in public hands and tradable. | Determines current Market Cap (Price × Circulating). |
| Total Supply | All tokens created minus verifiable burns. | Shows immediate dilution potential from team/treasury wallets. |
| Maximum Supply | The hard-coded upper limit of tokens ever to exist. | Defines long-term scarcity (e.g., Bitcoin's 21M cap). |
Circulating Supply: The Real Money in Play
Circulating Supply is the number of tokens actively trading on exchanges and held by users. Think of it like the float in stock markets-the shares available for buying and selling. This is the only number that directly impacts today’s price action. When traders talk about "market cap," they are almost always multiplying the current price by the circulating supply.
For example, as of late 2025, Bitcoin had roughly 19.6 million BTC in circulation. That is about 93.5% of its total possible supply. Because most of Bitcoin is already out there, new buyers have to compete with existing holders, which creates stability. Contrast this with newer projects where only 10% or 20% of tokens are circulating. If the price jumps, early investors and teams can dump their locked tokens onto the market, crashing the price even if demand stays high.
Here is the catch: not all circulating tokens are equal. Some sit in cold storage wallets untouched for years. Others are active on DeFi platforms. Tools like Glassnode track "effective supply" to filter out dead coins, showing that tokens with high network value-to-token supply ratios often outperform the broader market. But for basic valuation, stick to the standard circulating figure-it’s the baseline everyone uses.
Total Supply: The Hidden Dilution Risk
Total Supply includes every token that has been minted or issued, minus those that have been permanently burned. This number covers tokens sitting in treasury wallets, reserved for future ecosystem rewards, or held by the founding team but still locked via smart contracts. For many altcoins, Total Supply is significantly higher than Circulating Supply.
Take Aptos as a case study. In late 2025, it had over 1 billion APT in total supply, but only about 205 million were circulating. That gap represents massive potential dilution. If those remaining 800 million tokens enter the market without a proportional increase in demand, the price per token will drop. Investors who ignored this spread saw their holdings lose value as unlock schedules matured.
Burning mechanisms complicate this metric further. Projects like Shiba Inu reduce Total Supply by sending tokens to inaccessible addresses. As of December 2025, SHIB’s supply dropped from one quadrillion to under 590 trillion through verified burns. However, beware of "cosmetic burns." Sometimes, teams send tokens to an address but retain control, meaning the supply isn’t truly gone. Always check if burns are verifiable on-chain before trusting a reduced Total Supply figure.

Maximum Supply: The Scarcity Ceiling
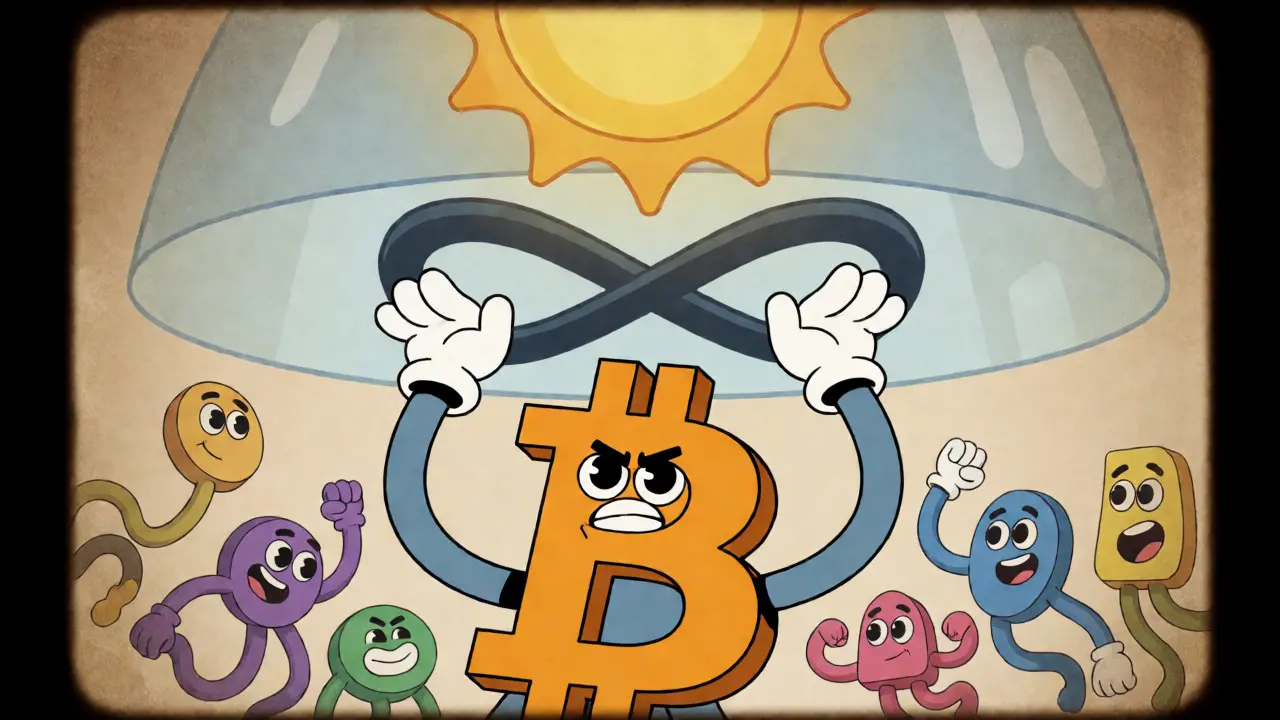
Maximum Supply is the theoretical hard cap coded into the blockchain’s genesis block. It answers the question: "How many tokens can ever possibly exist?" This metric is crucial for assets designed to mimic digital gold. Ethereum is a notable exception-it has no maximum supply. Instead, it relies on issuance rates controlled by upgrades like Dencun, which cut annual ETH issuance to roughly 0.45%.
For capped assets, Maximum Supply drives the narrative of absolute scarcity. Bitcoin’s 21 million cap is non-negotiable. This fixed limit creates deflationary pressure as demand grows against a shrinking pool of new coins. Data from Messari shows that capped assets like Bitcoin have historically commanded higher valuation multiples compared to uncapped tokens. Why? Because predictability reduces risk. You know exactly when the last Bitcoin will be mined (around 2140), allowing for precise long-term modeling.
However, don’t obsess over Maximum Supply for uncapped networks. Calculating Fully Diluted Valuation (FDV) for Ethereum using a hypothetical max supply is meaningless because there is no max. Instead, focus on the inflation rate. If a network issues new tokens faster than adoption grows, price stagnation follows. Conversely, if burn mechanisms exceed issuance (as seen in some L2 solutions), the net supply decreases, supporting price appreciation.
How Supply Gaps Impact Your Portfolio
The relationship between these three metrics reveals a project’s health. A healthy ratio exists when Circulating Supply is close to Total Supply, indicating low future dilution risk. Bitcoin fits this profile perfectly. On the flip side, a large gap between Circulating and Total Supply signals high risk.
Consider the "Unlock Schedule." Tokens are rarely released all at once. They vest over months or years. If you buy a token when only 10% is circulating, you must anticipate when the next 10%, 20%, or 30% hits the market. Arcane Research found that tokens with less than 30% circulating supply experienced an average price decline of 37.2% during major unlock events. This isn’t bad luck; it’s supply mechanics working as intended.
Here is a quick heuristic for evaluating supply risk:
- Low Risk: Circulating > 90% of Total Supply (e.g., Bitcoin). Price stability is higher due to limited new supply shocks.
- Medium Risk: Circulating 50-90% of Total Supply. Monitor vesting dates closely. Volatility increases around unlock cliffs.
- High Risk: Circulating < 30% of Total Supply. Extreme dilution potential. Only invest if you believe demand will massively outpace supply growth.
Common Pitfalls and How to Avoid Them
One major mistake is relying solely on Market Cap rankings. Exchanges often display Market Cap based on Circulating Supply. A low-cap coin might look undervalued until you realize its FDV (Fully Diluted Valuation) is ten times higher. FDV assumes all tokens are circulating. If a project has a high FDV relative to its Market Cap, it means a lot of supply is yet to come. Chris Burniske, a prominent crypto investor, warns that applying FDV logic to uncapped tokens like Ethereum creates false scarcity narratives. Don’t let a flashy chart distract you from the underlying supply math.
Another trap is ignoring the difference between "burned" and "locked." Locked tokens are part of Total Supply. They are not circulating, but they are not destroyed. When they unlock, they become part of Circulating Supply. Burns, however, remove tokens from Total Supply permanently. Verify burns through independent explorers like Etherscan or BscScan. Don’t take the project’s word for it.
Finally, remember that institutional investors now scrutinize these metrics heavily. A Consensys survey showed that 92% of professional investors require detailed unlock schedules before allocating capital. Retail traders who ignore these details often get caught holding bags when insiders exit. Use tools like TokenUnlocks.info to visualize upcoming supply injections. Knowing when a cliff is coming allows you to adjust positions or set stop-losses accordingly.
Practical Steps for Analyzing Token Supply
You don’t need a degree in economics to do this. Follow this simple workflow whenever you evaluate a new asset:
- Check the Whitepaper: Look for the hard-coded Maximum Supply. Does it exist? If yes, note the number.
- Verify Current Stats: Go to CoinGecko or CoinMarketCap. Note the Circulating and Total Supply figures. Calculate the percentage: (Circulating / Total) * 100.
- Find the Unlock Schedule: Search for "[Token Name] vesting schedule." Identify the next major unlock date and amount.
- Assess Demand Drivers: Is there real utility driving demand? High supply growth is manageable if usage explodes. Low utility plus high supply growth equals price collapse.
- Monitor On-Chain Data: Use platforms like Nansen or Glassnode to see if whales are accumulating or distributing. Large inflows to exchanges often precede sell-offs.
This process takes minutes but saves thousands. It shifts your perspective from gambling on charts to investing in economic structures.
What is the difference between market cap and fully diluted valuation?
Market Cap uses Circulating Supply (tokens currently trading), while Fully Diluted Valuation (FDV) uses Maximum Supply (all tokens that will ever exist). FDV shows the potential value if all tokens were released, helping you gauge long-term dilution risk.
Does a lower circulating supply mean a higher price?
Not necessarily. Price is determined by supply and demand. A token with low supply but zero demand will trade near zero. Conversely, a token with high supply but massive demand (like Dogecoin) can maintain significant value. Supply alone doesn't dictate price.
Why does Ethereum not have a maximum supply?
Ethereum was designed as a flexible platform rather than a store of value. Post-Merge, it uses a dynamic issuance model where new ETH is created for validator rewards but burned for transaction fees. This allows supply to adjust based on network activity rather than being fixed.
What happens when a token's total supply exceeds its maximum supply?
This usually indicates a data error or a recent upgrade that changed the cap. In rare cases, governance votes may alter the maximum supply. Always check official project announcements if these numbers conflict, as it affects scarcity assumptions.
How do token burns affect supply metrics?
Burns reduce both Total Supply and, eventually, Circulating Supply if the burned tokens were previously circulating. However, burns sent from treasury wallets reduce Total Supply immediately but do not impact Circulating Supply until those tokens would have otherwise entered the market.






Write a comment