



Ever wonder why your best agent has the longest calls but the happiest customers? Or why a high-volume team suddenly sees satisfaction scores drop? It’s not magic; it’s data. In the world of VoIP analytics, understanding agent performance metrics is the difference between a chaotic floor and a well-oiled machine. We aren't just talking about counting minutes here. We're talking about decoding behavior, predicting burnout, and actually making money.
If you’re still judging agents solely by how fast they hang up, you’re likely missing half the picture. Modern contact centers are generating billions of data points daily. The challenge isn’t collecting them; it’s knowing which ones matter for individuals versus teams. Let’s break down the stats that actually drive results, separating the signal from the noise so you can stop guessing and start optimizing.
The Core Trio: Speed, Quality, and Resolution
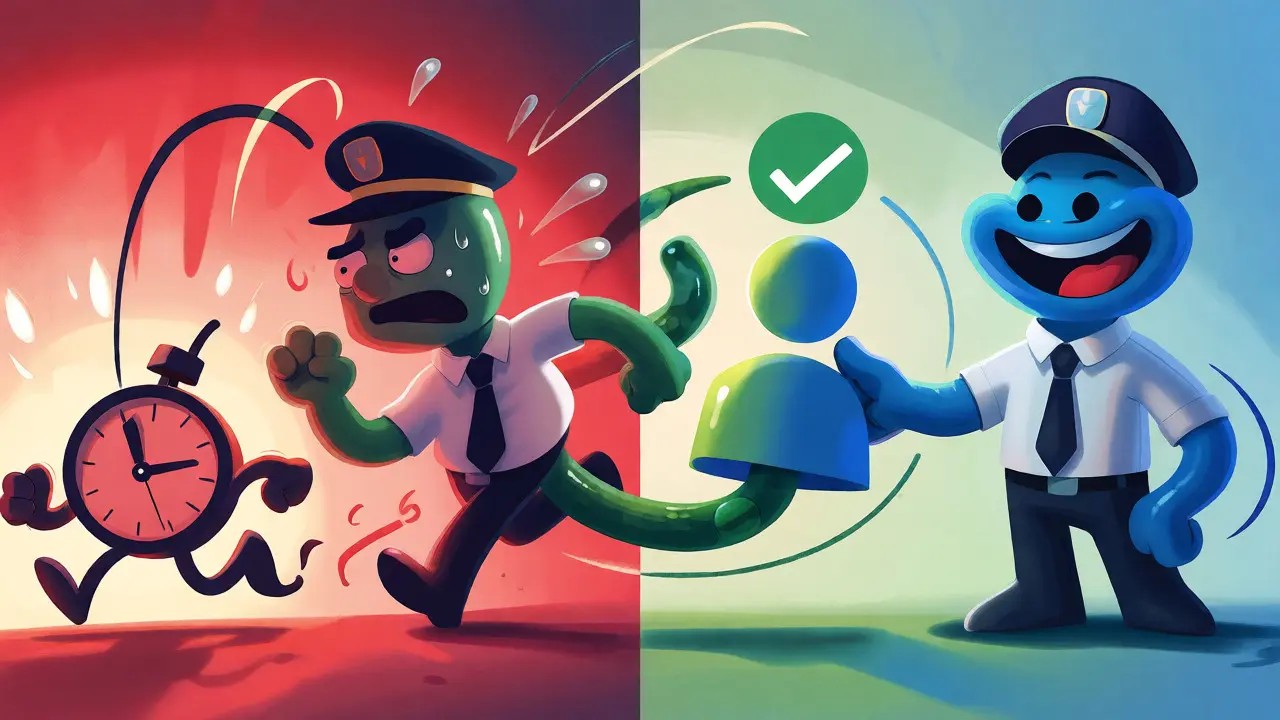
When we look at individual performance, three metrics dominate the conversation: Average Handle Time (AHT), First Contact Resolution (FCR), and Customer Satisfaction (CSAT). But here’s the trap: these numbers don’t exist in a vacuum. They fight each other. If you push an agent to lower their AHT, their FCR often drops because they rush. If you demand perfect CSAT, AHT might balloon as agents spend extra time soothing frustrated callers.
Average Handle Time is calculated by taking total talk time, hold time, and after-call work, then dividing by the number of calls handled. Industry benchmarks vary wildly. Retail might see healthy averages around 4.5 minutes, while technical support could sit comfortably near 11.2 minutes. Comparing a retail agent to a tech support specialist on AHT alone is like comparing a sprinter to a marathon runner. Both are running, but the goals are totally different.
Then there’s First Contact Resolution. This is arguably the most critical metric for loyalty. It measures the percentage of issues solved without the customer needing to call back. Top-performing centers hit 70-80% FCR. Why does this matter? Because every repeat contact costs money and erodes trust. An agent with a slightly higher AHT but a 90% FCR rate is often more valuable than one with a low AHT who forces the customer to call back twice.
Finally, Customer Satisfaction Score gives us the human element. Measured on a 1-5 or 1-10 scale, it captures how the customer felt. But beware of cultural bias. A study by Harvard Business Review noted that NPS scores in Germany average 15 points lower than in the US for identical experiences. Don’t let regional quirks skew your global team comparisons.
Beyond the Basics: Effort and Sentiment
Satisfaction is good, but effort is better. Enter the Customer Effort Score. Research from Gartner suggests that CES is replacing CSAT as the leading indicator of loyalty. Why? Because people don’t necessarily return because they were "happy"; they return because it was easy. Lower effort scores correlate directly with repurchase behavior. If an agent makes a customer jump through hoops to get a refund, even if the outcome is positive, the relationship suffers.
We also need to talk about sentiment. Traditional metrics miss the emotional arc of a call. Did the caller start angry and end neutral? Or did they start calm and leave furious? New AI-driven tools now track Sentiment Resolution Score, analyzing voice tone and word choice throughout the interaction. This helps identify agents who de-escalate tension effectively, even if their resolution time is longer. It’s a qualitative metric made quantitative, offering a deeper view of soft skills.
Team Statistics: The Bigger Picture
Individual stats tell you who needs coaching. Team stats tell you if your strategy is working. When you aggregate data, you look for trends. Are certain shifts consistently hitting lower FCR rates? Is the new hire cohort struggling with specific product lines? Team-level analysis reveals systemic issues rather than individual failures.
One key team metric is Schedule Adherence. This measures how closely agents stick to their assigned times for breaks, lunches, and calls. While crucial for staffing forecasts, it’s controversial. Critics argue that obsessing over adherence below 85% creates toxic environments. If agents feel micromanaged to the second, burnout rises. Turnover can spike from 15% to 35% in six months if management uses adherence as a punishment tool rather than a planning aid.
Another vital team stat is Occupancy Rate. This shows the percentage of logged-in time agents spend handling interactions versus waiting. High occupancy (above 85%) means agents are constantly busy, which can lead to errors and stress. Low occupancy might indicate overstaffing. Finding the sweet spot-usually between 75-85%-keeps agents engaged without burning them out.
The Danger of Metric Overload
Here’s a hard truth: tracking too many metrics kills performance. A McKinsey study of 150 contact centers found that top performers track only 7-12 core metrics. Struggling teams try to monitor 20+. Why? Because when everything is important, nothing is. Agents get confused about priorities. Do I prioritize speed? Accuracy? Empathy? You can’t do all three perfectly at once.
Start with 3-5 metrics tied directly to business outcomes. For example, if your goal is reducing churn, focus on FCR and CES. If your goal is cost reduction, watch AHT and Occupancy. Expand only when your team masters the basics. Remember, data silos are a major hurdle. 68% of organizations struggle to integrate data across platforms. Ensure your VoIP provider’s analytics sync seamlessly with your CRM. Otherwise, you’re looking at two different truths.

Implementing Metrics Without Breaking Your Team
How you present data matters as much as the data itself. Use dashboards that visualize progress, not just raw numbers. Gamification platforms like Spinify suggest starting small. Celebrate improvements in FCR before cracking down on AHT. Training requirements vary, but expect 8-16 hours for basic interpretation. For advanced roles, certifications like COPC’s Performance Management Professional require 120+ hours.
Also, consider the context. An AHT of 6 minutes might be excellent for a complex insurance claim but poor for a simple password reset. Always contextualize metrics against call type. Dr. John Goodman of Tethra emphasizes this point repeatedly. Blindly applying average targets across diverse call types sets agents up for failure.
| Metric | Primary Focus | Industry Benchmark | Risk of Misuse |
|---|---|---|---|
| Average Handle Time (AHT) | Efficiency/Cost | 4.5 - 11.2 mins (varies by industry) | Rushing customers; higher repeat contacts |
| First Contact Resolution (FCR) | Loyalty/Efficiency | 70% - 80% | Ignoring complex cases that need follow-up |
| Customer Satisfaction (CSAT) | Experience | 75% - 85% satisfied responses | Cultural bias; survey fatigue |
| Customer Effort Score (CES) | Retention | 1.8 avg on 5-point scale | Over-simplifying complex journeys |
| Schedule Adherence | Staffing Accuracy | >85% | Toxic culture; increased turnover |
The Future: AI and Holistic Value
The landscape is shifting. By 2026, Gartner predicts 70% of contact centers will replace traditional AHT targets with holistic Customer Lifetime Value (CLV) metrics. We’re moving away from operational tracking toward strategic business drivers. AI agents are changing the game too. Traditional human metrics don’t capture AI behaviors like hallucination rates or context window management. New metrics like Task Completion Rate (TCR) are emerging, with advanced AI systems achieving 85-92% in structured tasks.
Real-time coaching is becoming standard. Instead of reviewing calls weeks later, supervisors use live sentiment analysis to nudge agents mid-conversation. This transforms metrics from historical reports into active tools for improvement. The goal isn’t just to measure performance; it’s to enhance it in the moment.
Ultimately, the right metrics depend on your business model. E-commerce prioritizes speed. Financial services prioritize compliance. Choose wisely, balance carefully, and always keep the human element in mind. Data should empower your agents, not punish them.
What is a good Average Handle Time for a call center?
There is no single "good" AHT. It depends heavily on the industry and complexity of calls. Retail might aim for 4-5 minutes, while technical support could range from 8-12 minutes. Always benchmark against similar call types within your own organization rather than generic industry averages.
Why is First Contact Resolution considered more important than speed?
FCR correlates strongly with customer loyalty and reduces overall costs. A quick call that doesn’t resolve the issue leads to repeat contacts, increasing total handle time and frustrating the customer. Resolving issues on the first attempt builds trust and efficiency in the long run.
How many metrics should a contact center track?
Research suggests tracking 7-12 core metrics is optimal. Tracking more than 15 often leads to diminishing returns and confusion among agents. Start with 3-5 key metrics aligned with business goals and expand gradually as your team matures.
Can focusing too much on AHT hurt customer satisfaction?
Yes. Companies that optimize solely for low AHT often see 15-20% higher repeat contacts. Agents may rush interactions to meet time targets, leaving customers feeling unheard or unresolved, which lowers CSAT and increases future workload.
What is the difference between CSAT and CES?
CSAT measures how satisfied a customer is with an interaction. CES measures how easy it was for the customer to get their issue resolved. CES is increasingly seen as a better predictor of loyalty because ease of use drives repurchase behavior more strongly than momentary satisfaction.





Write a comment